| March 18, 2019
It has often been said that what is measured by an organisation is what gets managed. It is also true that information relevant to one group of people within a company may be less than useful to another. Therefore, even for a small business, setting up a Management Information System that captures data and turns it into actionable information that is timely, accurate and relevant is vitally important if key people are able to improve business performance.
The design philosophy behind uzERP is to make such information accessible and consistent for all users of the system - lists, dashboards and custom reports make this possible without the need for any external software. If these don’t go far enough then the open source database back-end allows for integration with other suitable systems such as spreadsheets and third party reporting tools.
As an integrated business system, uzERP can quickly generate lots of transactions directly from your daily workflow - by providing a single source of truth, all users will be working from the same source data irrespective of the analysis they need to carry out to make critical decisions.
Management Information directly from uzERP
So let’s start with the basics - how can you get at the data uzERP generates and turn it into information.
List Views
uzERP uses a list based system to display most data. Each view has default and extended options for selection and sorting allowing the user to find the information they are looking for very quickly, in a consistent manner across all modules.
As an example of the interface, see the list below of outstanding sales orders - this can be selected by customer, product, due date and status.
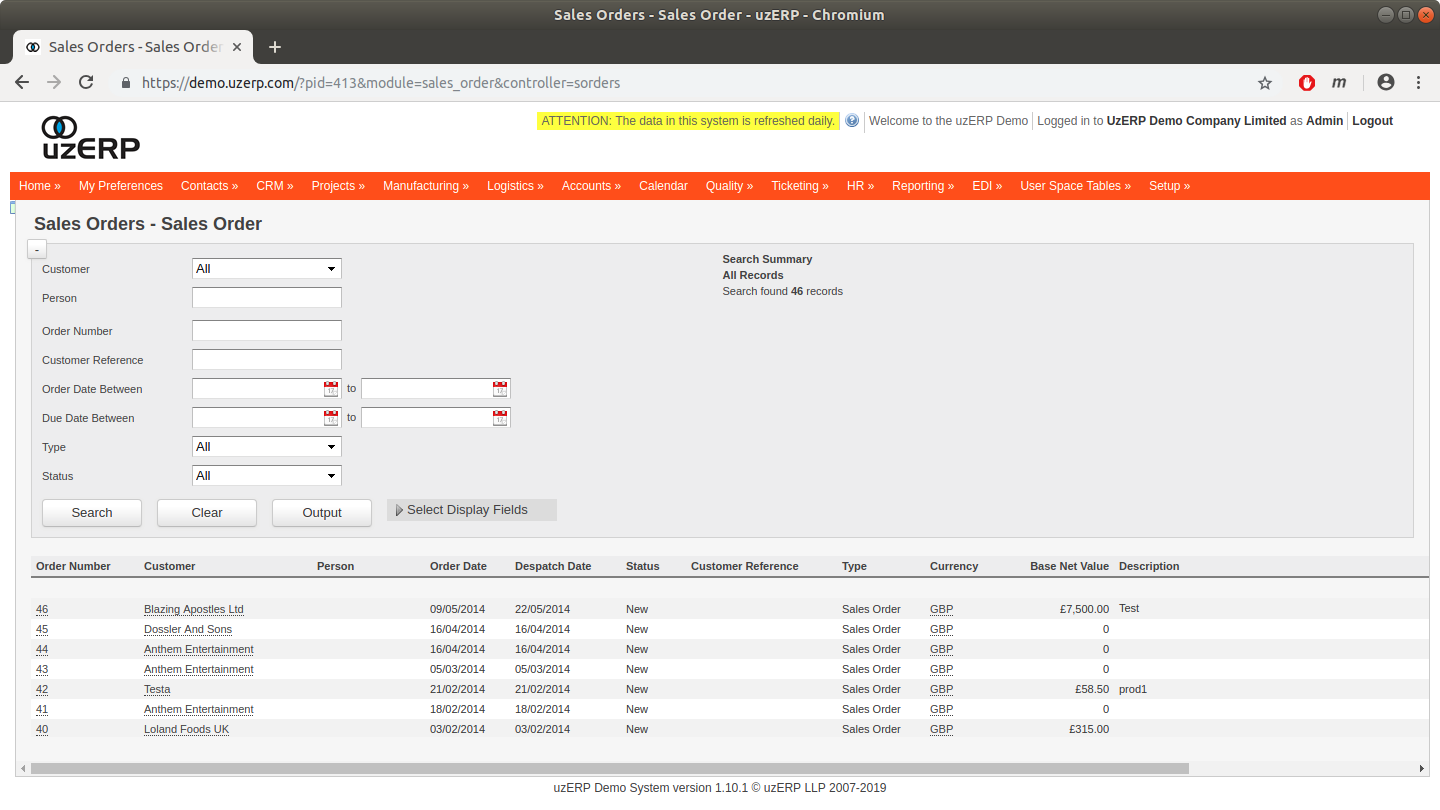
The Sales Order list view
There is also the option to select columns displayed from those available by clicking the ‘select display fields’ drop down and dragging the available fields. The standard uzERP interface can therefore act as a ‘self-service’ reporting system for basic requirements.
Once the data required by the user is displayed in the list it can be printed, emailed or output to csv/xml for further analysis in spreadsheets or other third party systems.
Integrated Dashboards
Dashboards are another way of getting information in front of decision makers. uzERP has a simple system of pre-built widgets, called “uzLETS” - these are small data summaries and graphs that can be placed on a user’s home page or the individual module front page. Each user can customise their own view to show only the uzLETS that are relevant to them and their daily working environment.
There are many uzLETS pre-installed with the system ranging from Aged Debtors to Overdue Purchase Orders. Here are a couple of examples from the uzERP demo system:
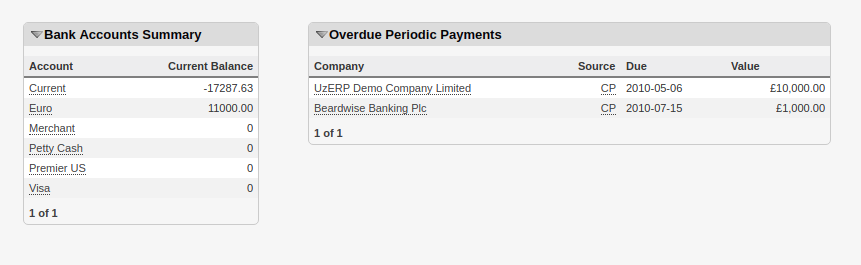
Cash Book module uzLETS
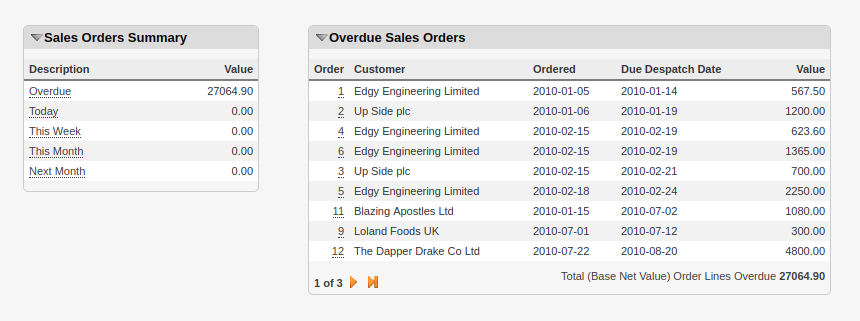
Sales Order module uzLETS
As you can see from the above examples, there are embedded links enabling the user to drill-down for more detailed information - as such uzLETS are an impactful way of getting information in front of users in bite sized chunks. As well as being informational, because they are always up to date, they can take the form of a ‘call to action’ for users and are a useful part of daily workflow.
Reporting Module
For more detailed analysis, uzERP has an integrated reporting module. It is possible to develop fully customised views of the available data in the back-end database using standard SQL, and then use this to drive multiple reports applicable to the business.
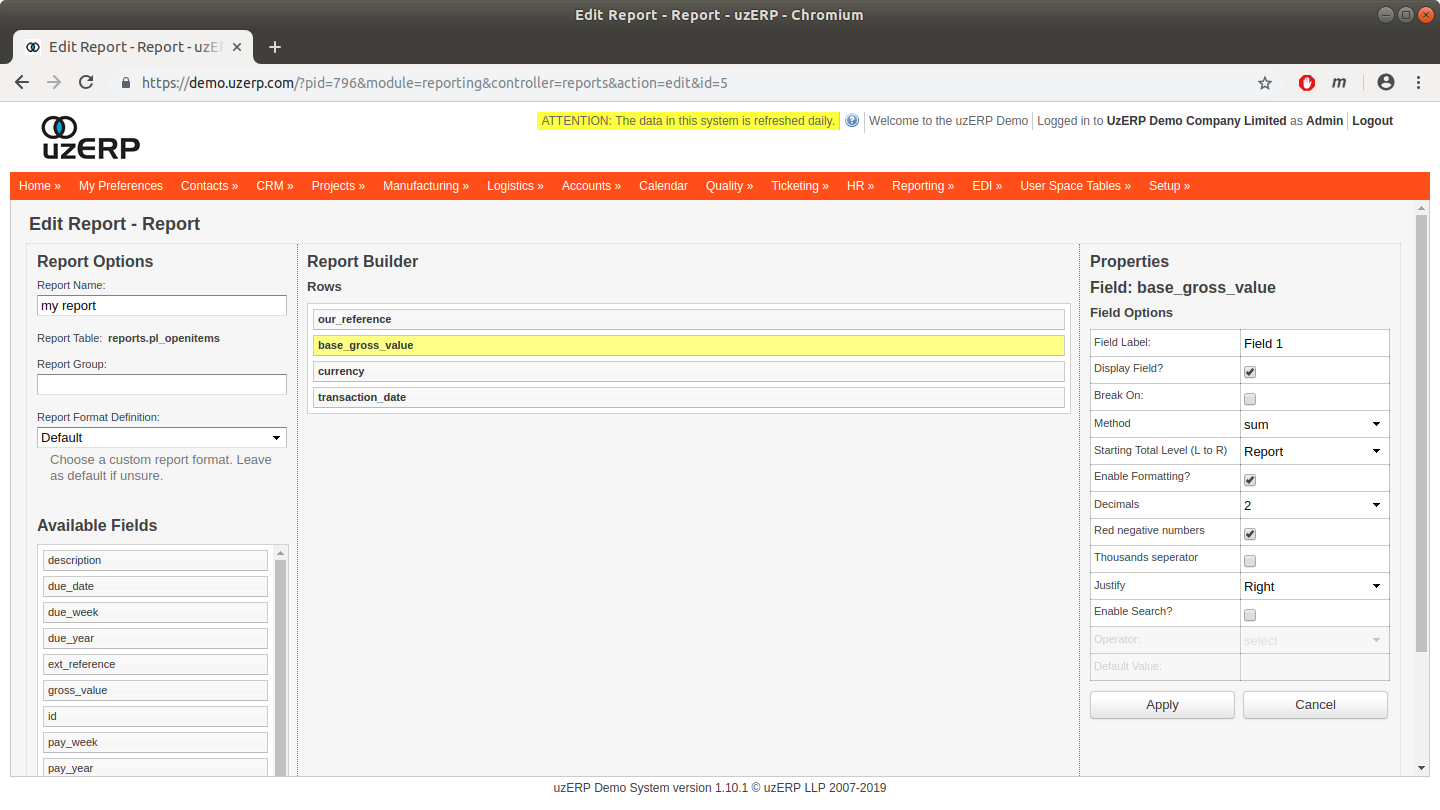
Report writer example
Examples of the reports that have been developed are
- Sales analysis by Customer/Product/Location
- Stock movement analysis
- Scrap and waste reports
- Manufacturing Cell performance
Reports can be grouped by type, and published to particular user roles, so that users only see the reports they need. In addition, reports that form part of daily workflow can be attached to the menu system so that they appear as standard lists to the user.
External Management Information Systems
Spreadsheets
As already mentioned, it is possible to export data from the standard views in the system, or from custom SQL reports, in csv or xml format for import into spreadsheet reporting systems.
However, we can go one step further.
Data can be piped into spreadsheets from uzERP’s database using a variety of live connectors, including ODBC for Excel and the native postgreSQL connection from LibreOffice. Once this is done the the data from uzERP can feed automated analysis using pivot tables (and PowerPivot in Excel) or the spreadsheet program’s integrated charting capabilities. Large volumes of transactions can be included from source data with no re-keying by the user, improving the accuracy of the information generated and the speed with which it can be compiled.
In a later blog post I’ll outline how this can be achieved, and give some real world examples of the types of analysis that can be accomplished using these tools.
Web based reporting
A good dashboard can help drive the decision-making process rather than simply present information - especially if it is clear, informative and visually appealing. In the past setting up these systems has been time consuming and expensive for the SME.
Recently, however, web-based tools for reporting and analysis have become mainstream, and have brought advanced dashboard creation and data exploration into the small business sector. Recently we have developed fully customised online dashboards and visualizations using the following open source tools directly linked to the uzERP database:
- Redash - we have a client that has a sales dashboard developed by us in Redash;
- Apache Superset - Superset can replace spreadsheets with the ability to explore and visualize data within a browser environment and includes fine-grained access control;
- Shiny Dashboard - this system has been used to provide a fully integrated on-line Management Reporting system covering Sales, Operations and Financial information.
Final thoughts
uzERP uses an open source database system making the availability of the underlying data a given - your data is yours and you always have free access using whichever tool is appropriate in your situation.
The techniques and tools outlined above provide a way to enable us to implement enterprise class reporting and analysis. This is especially powerful for small businesses who are resource constrained, because they are being fed live data from the uzERP system, which improves decision making efficiency at an affordable cost.
Need help with some of your own Management Information challenges? Would you like to talk more about uzERP or any of the tools I’ve mentioned? Then do please get in touch via the Contacts Page.